Project Portfolio Management (PPM)
The PPM module provides a complete project portfolio management solution for tracking initiatives, budgets, risks, tasks, and timelines. It integrates directly with the Initiative card type to enrich each project with status reporting, cost tracking, and Gantt visualization.
Note
The PPM module can be enabled or disabled by an administrator in Settings. When disabled, PPM navigation and features are hidden.
Portfolio Dashboard
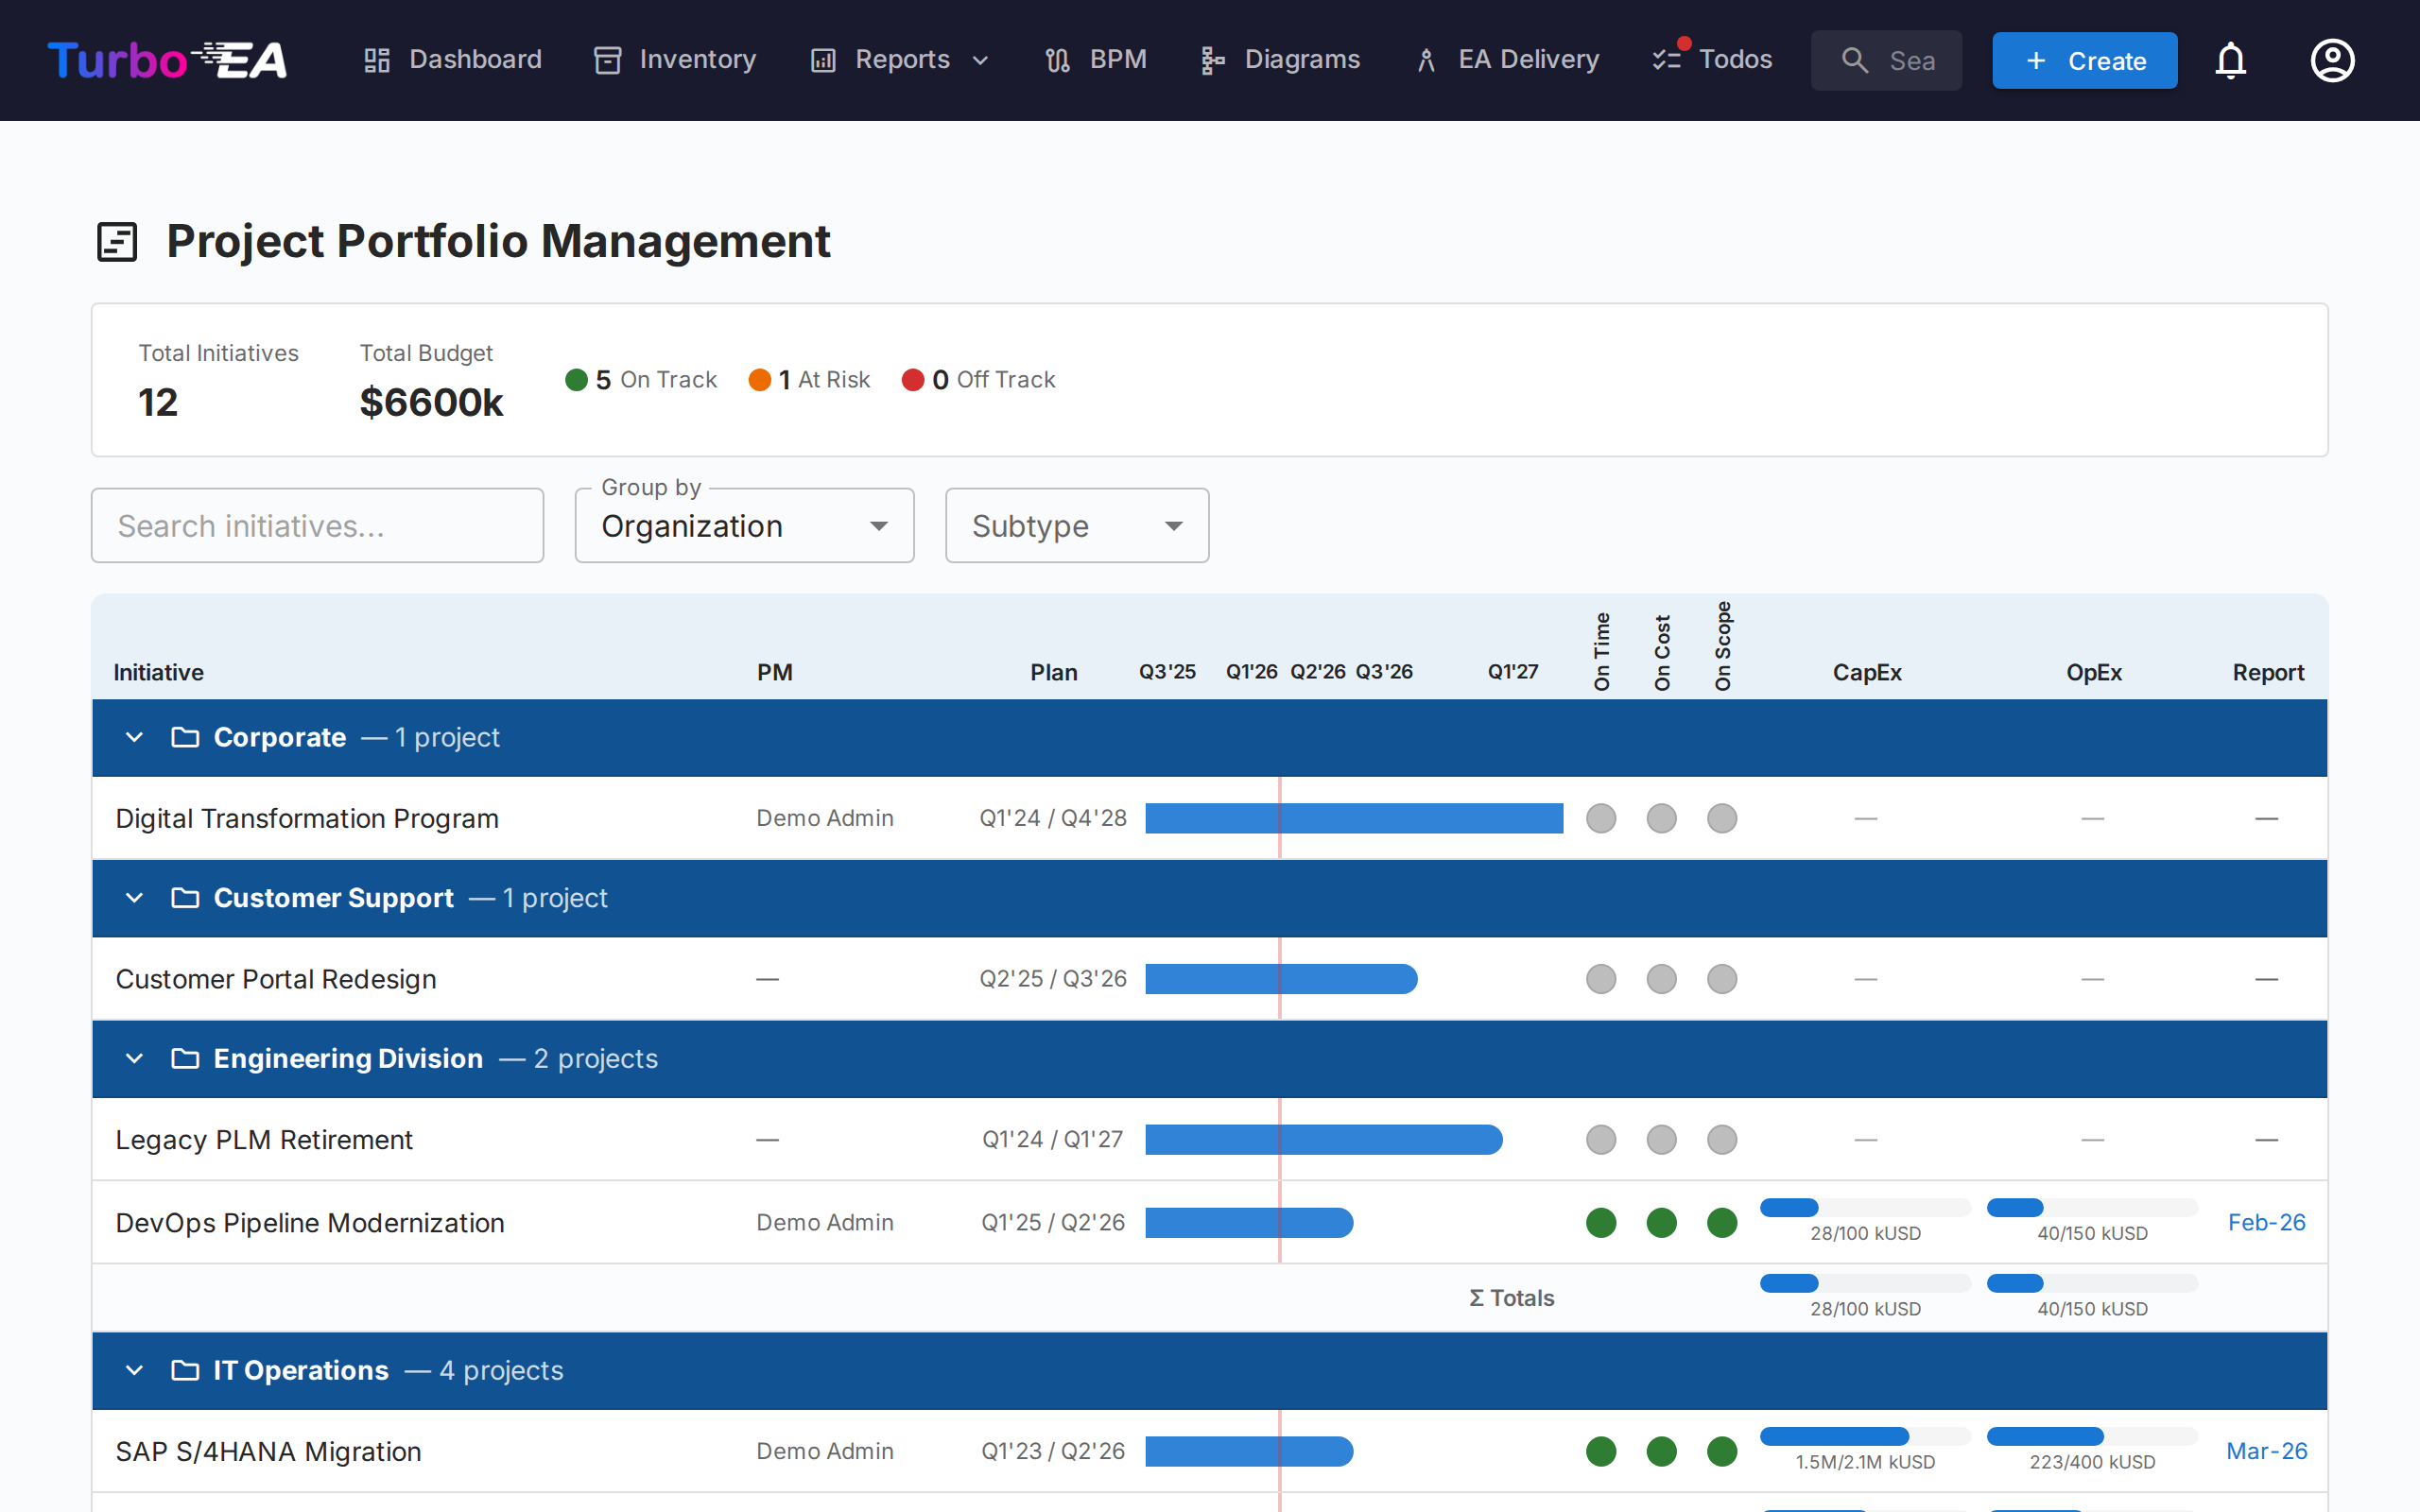
The Portfolio Dashboard is the main entry point for PPM. It provides:
- KPI Cards — Total initiatives, total budget, total actual cost, and health status summaries
- Health Pie Charts — Distribution of schedule, cost, and scope health (On Track / At Risk / Off Track)
- Status Distribution — Breakdown by initiative subtype and status
- Gantt Overview — Timeline bars showing each initiative's start and end dates, with RAG health indicators
Grouping & Filtering
Use the toolbar to:
- Group by any related card type (e.g., Organization, Platform) to see initiatives grouped by business unit or technology platform
- Filter by subtype (Idea, Program, Project, Epic)
- Search by initiative name
These filters persist in the URL, so refreshing the page retains your current view.
Initiative Detail View
Click any initiative to open its detail page with seven tabs:
Overview Tab
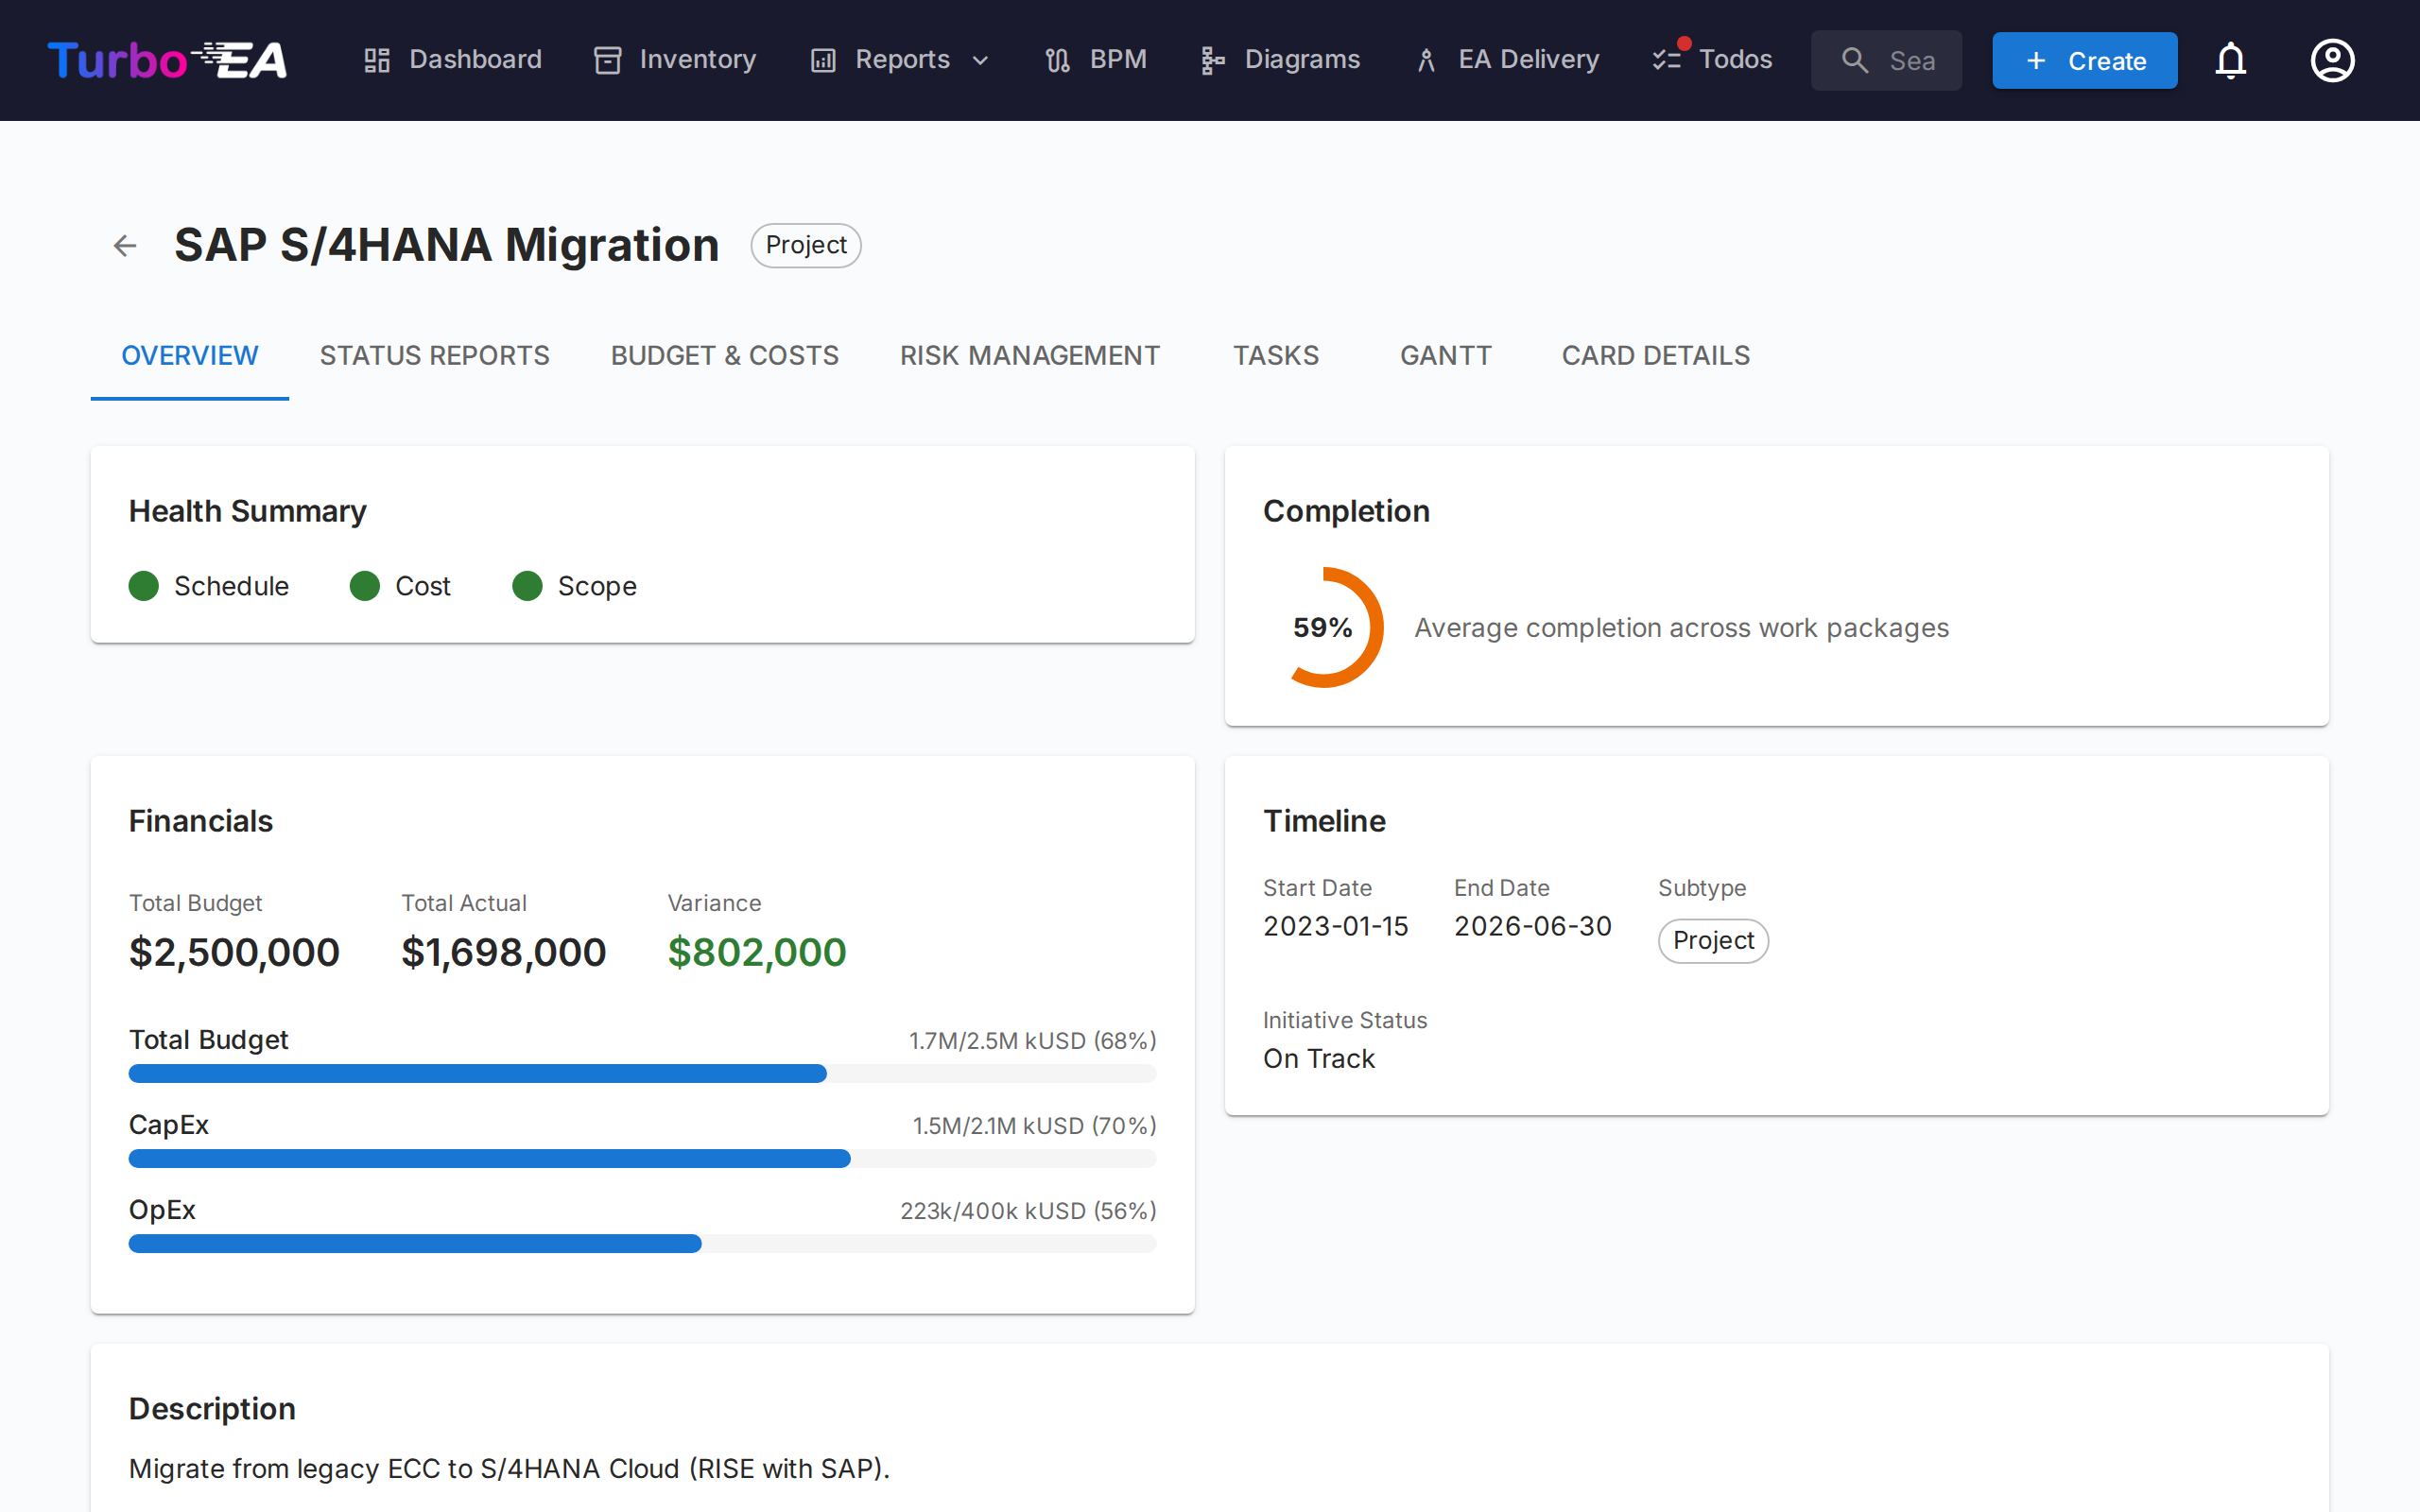
The overview shows a summary of the initiative's health and financials:
- Health Summary — Schedule, cost, and scope indicators from the latest status report
- Budget vs. Actual — Combined KPI card showing total budget and actual spend with variance
- Recent Activity — Latest status report summary
Status Reports Tab
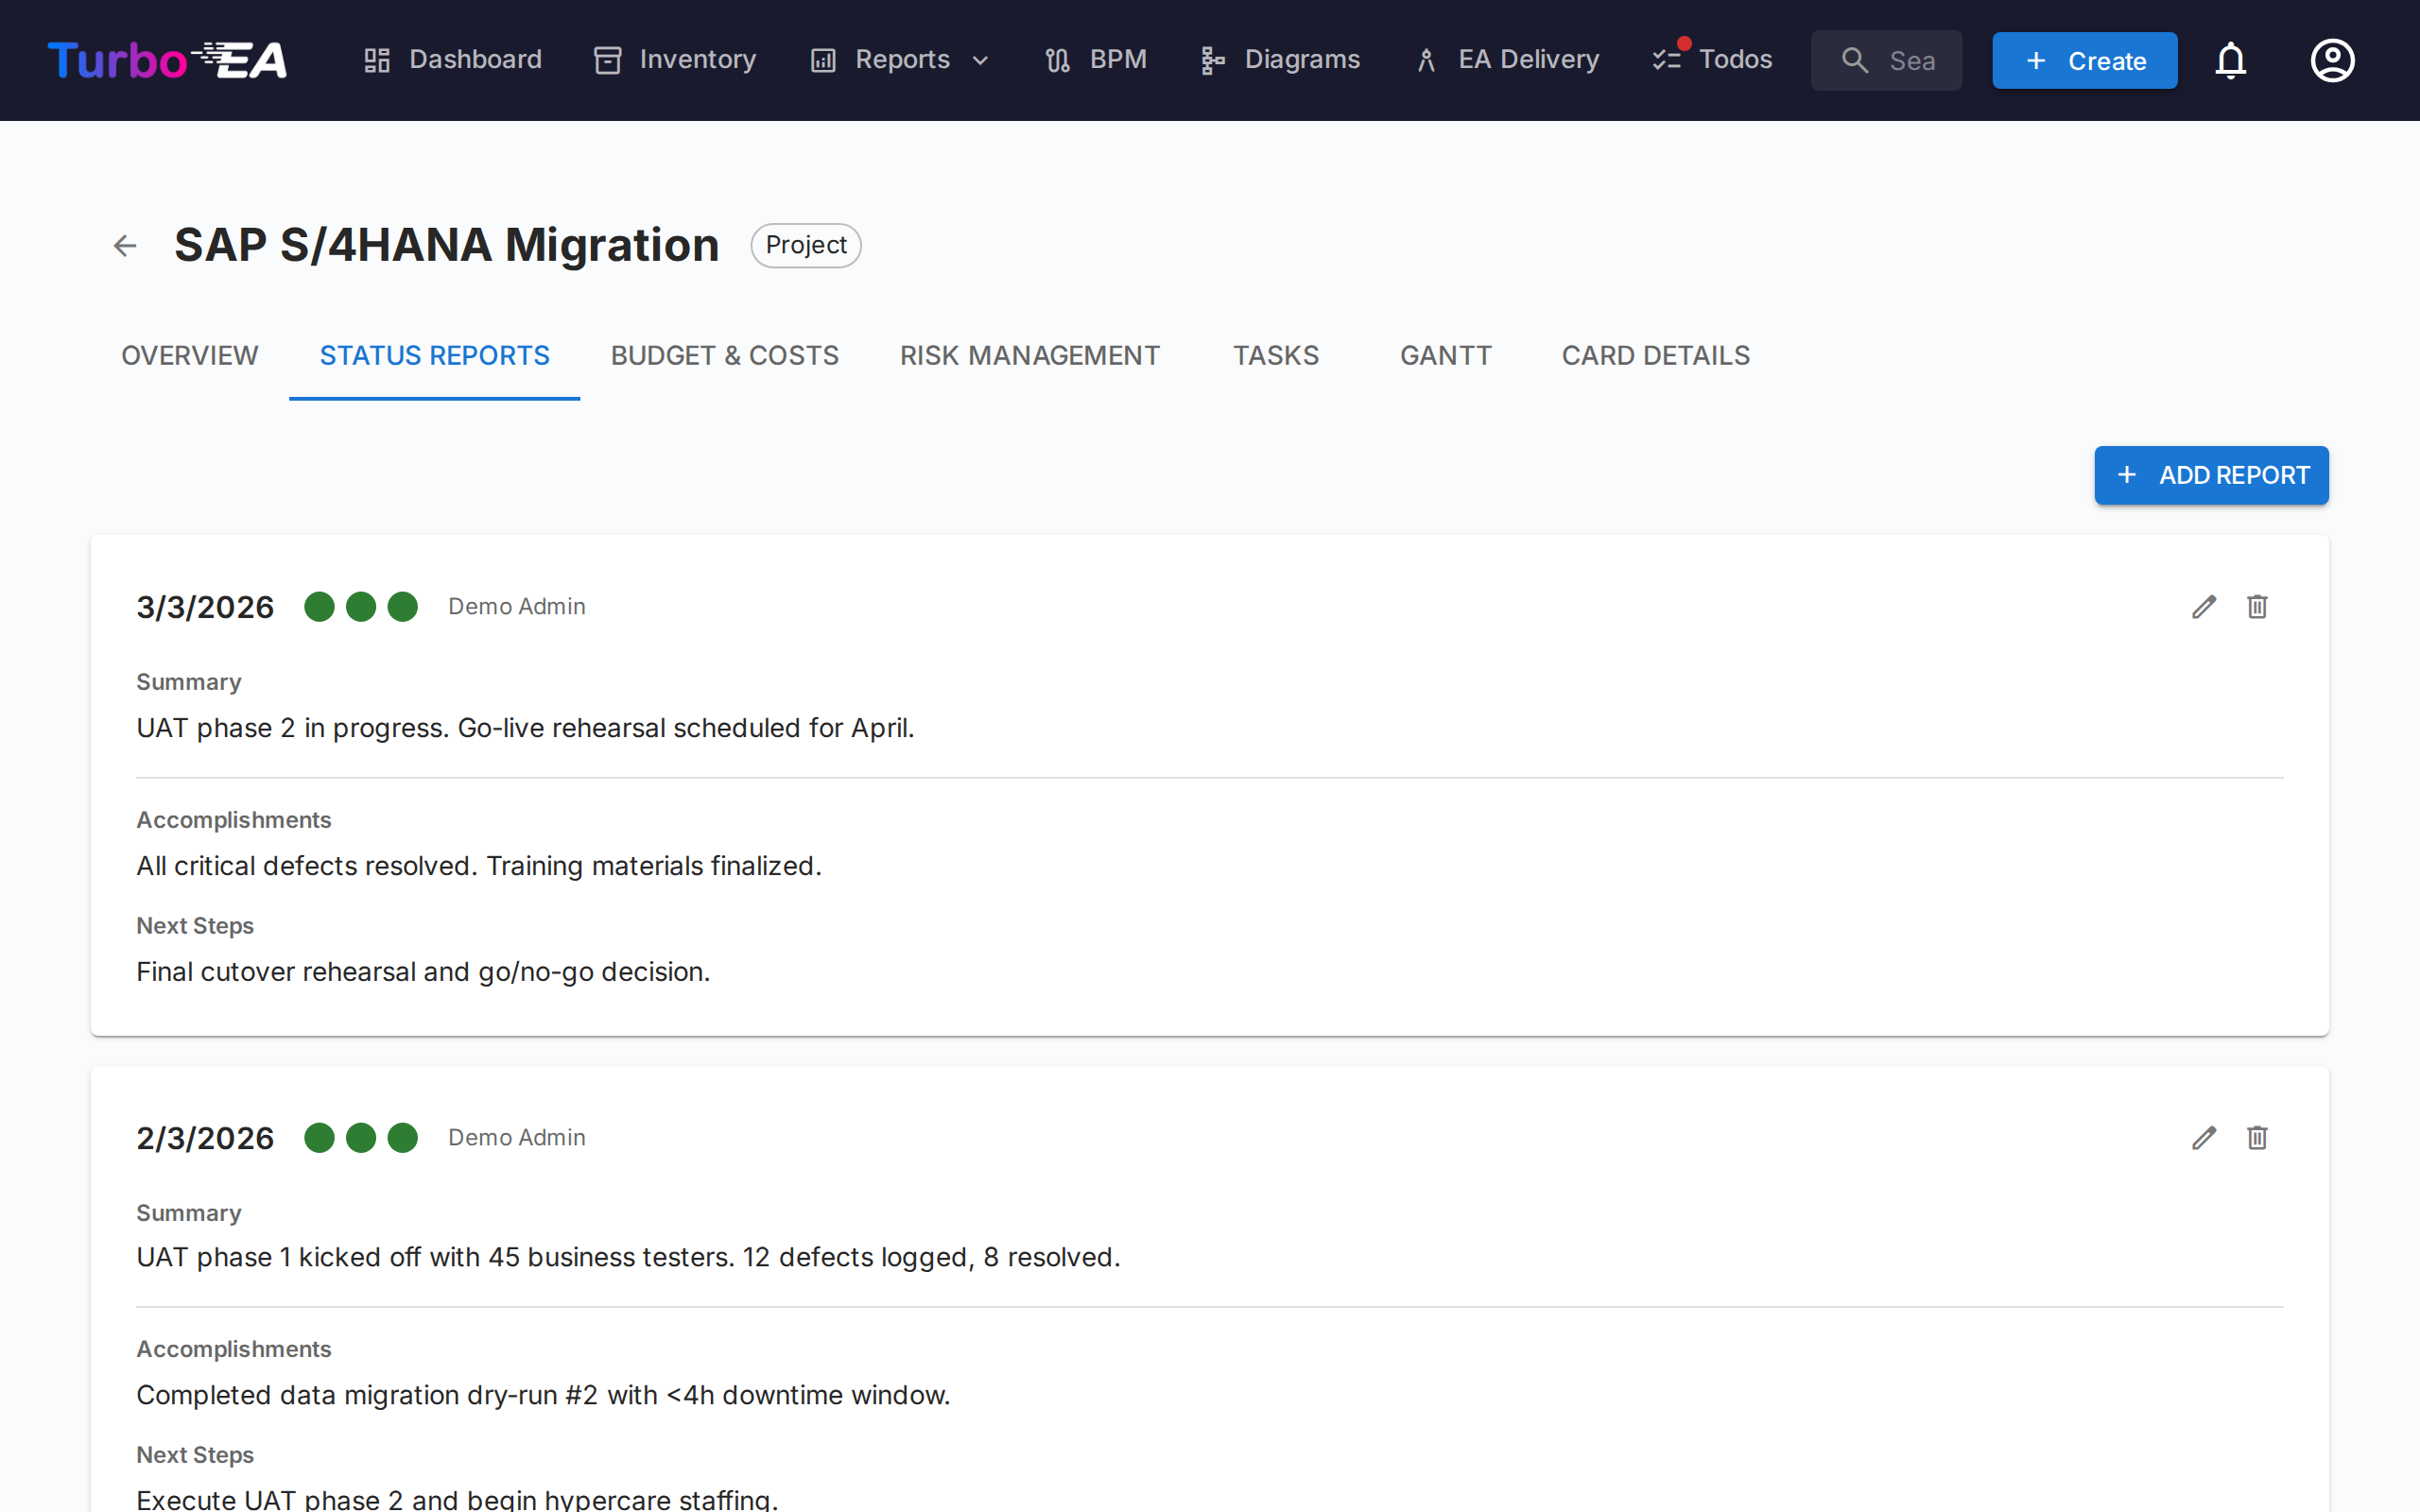
Monthly status reports track project health over time. Each report includes:
| Field | Description |
|---|---|
| Report Date | The reporting period date |
| Schedule Health | On Track, At Risk, or Off Track |
| Cost Health | On Track, At Risk, or Off Track |
| Scope Health | On Track, At Risk, or Off Track |
| Summary | Executive summary of current status |
| Accomplishments | What was achieved this period |
| Next Steps | Planned activities for the next period |
Budget & Costs Tab
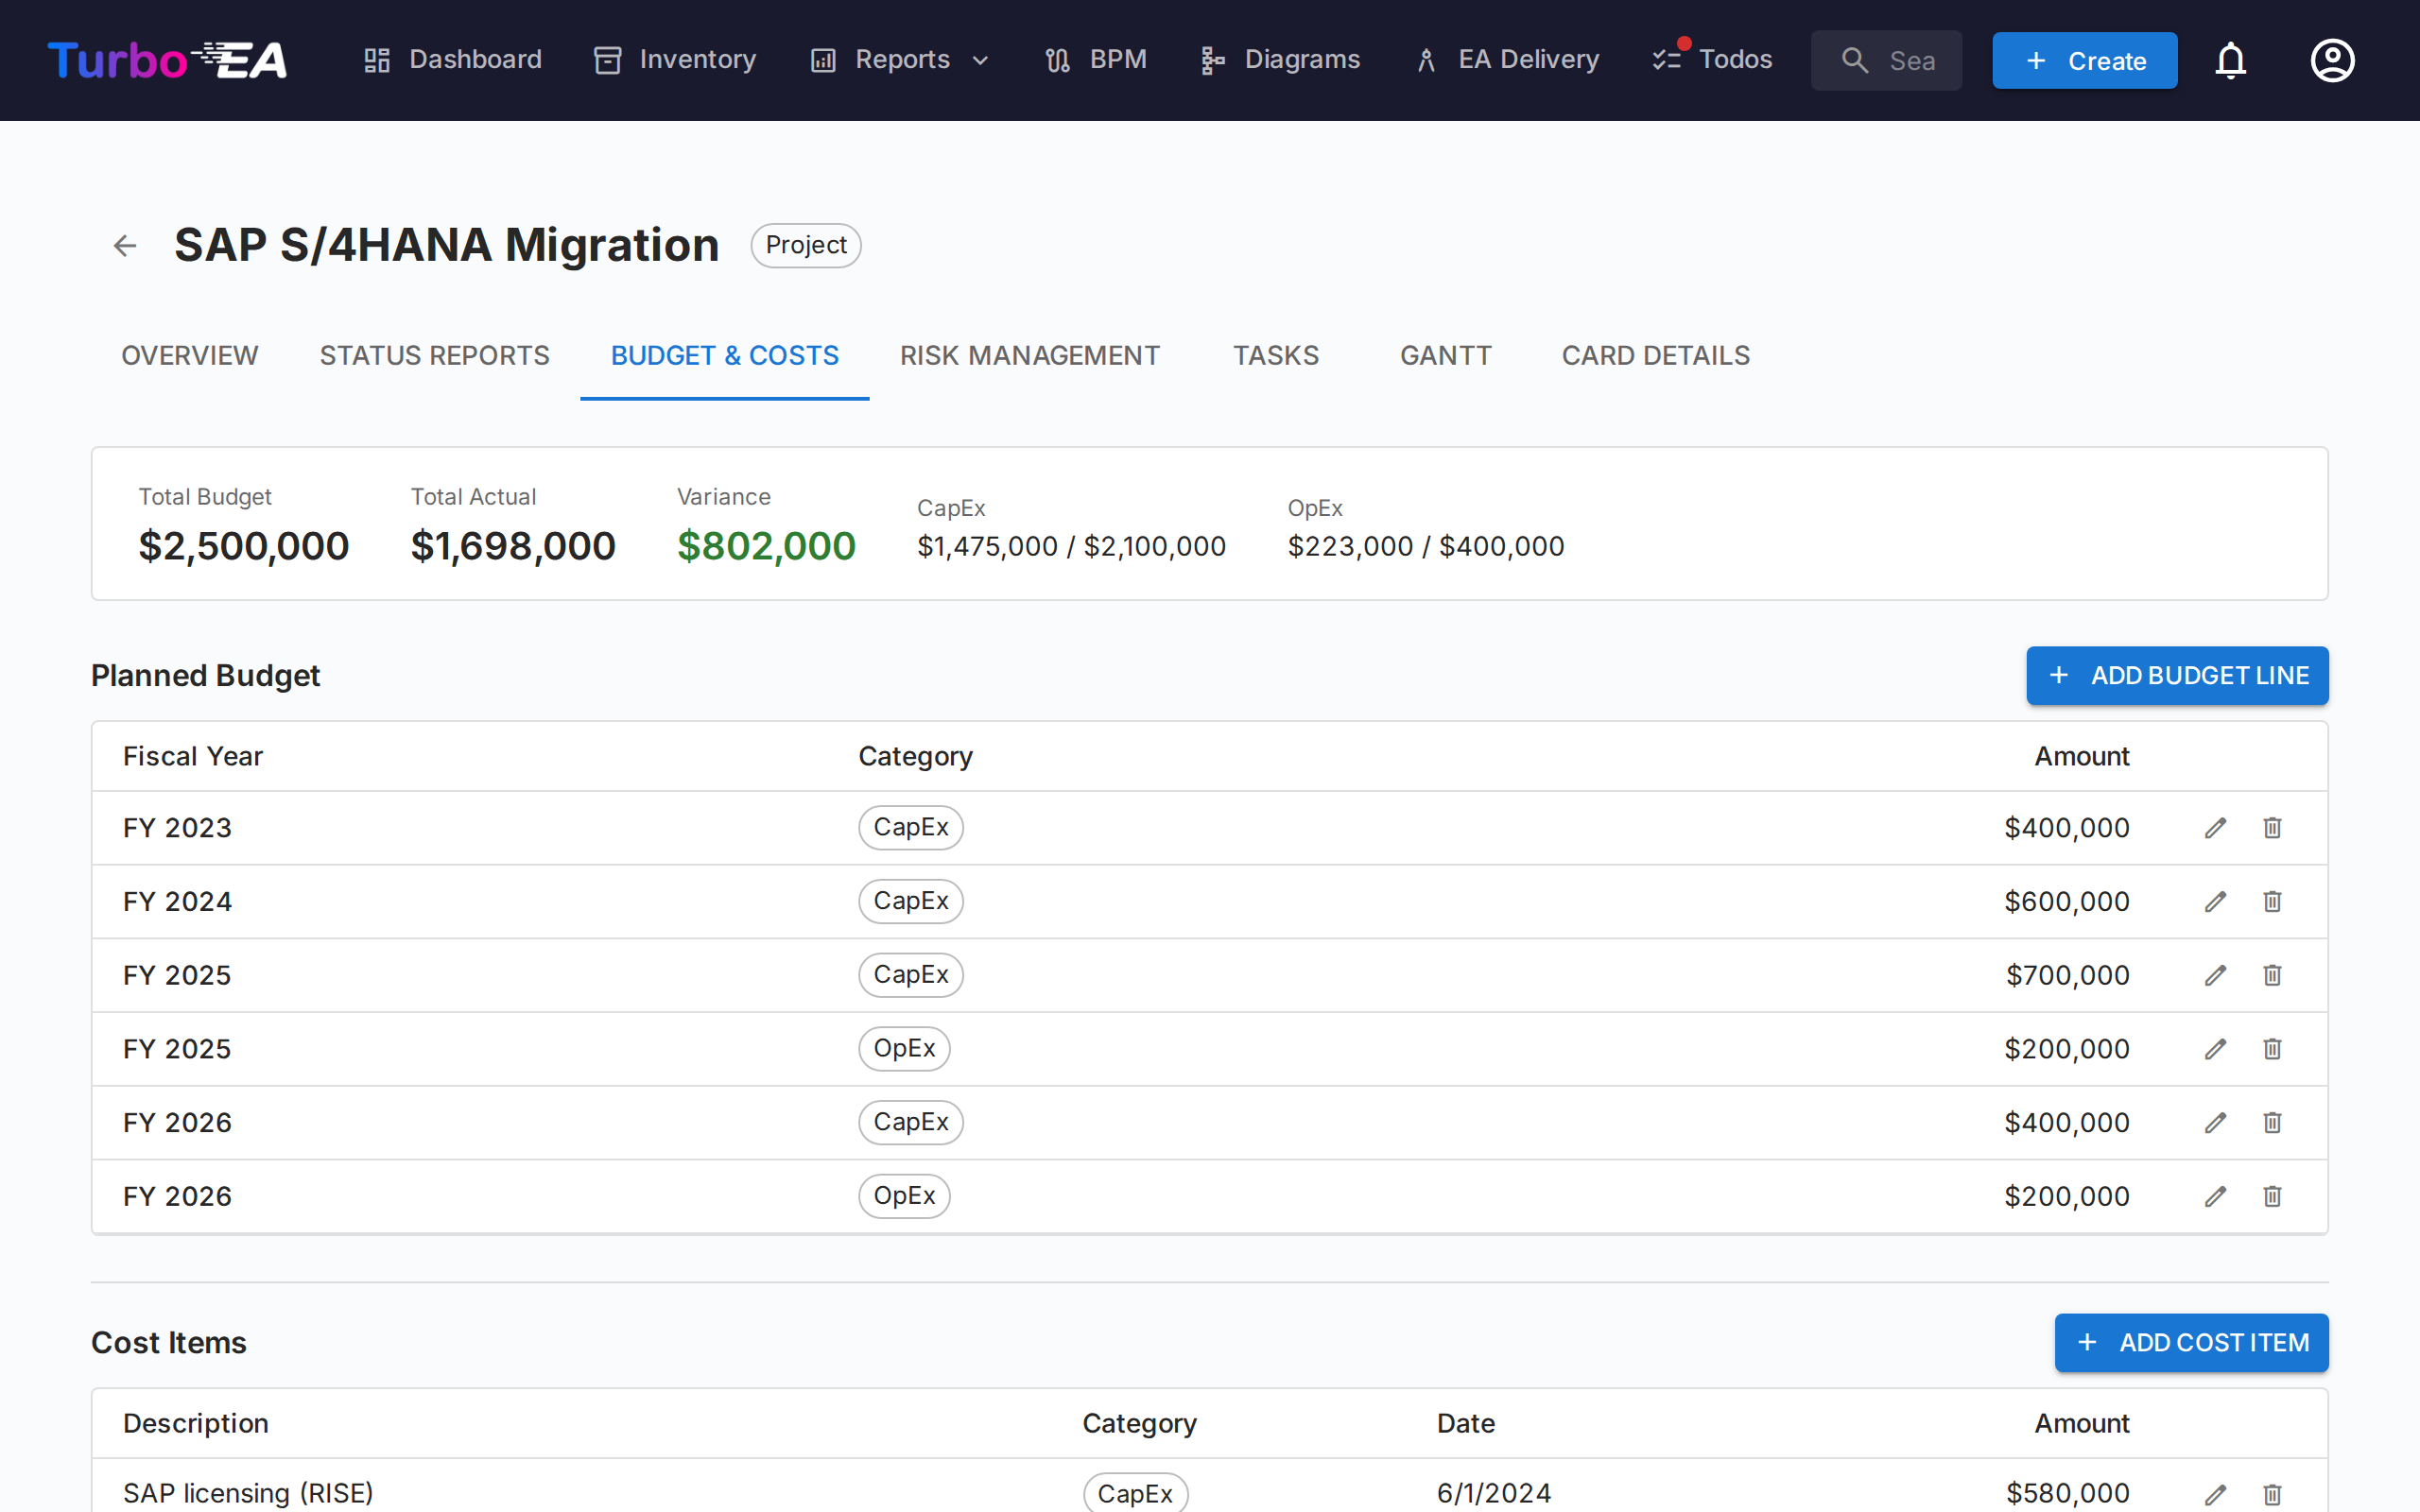
Track financial data with two types of line items:
- Budget Lines — Planned budget by fiscal year and category (CapEx / OpEx). Budget lines are grouped according to the fiscal year start month configured in Settings. For example, if the fiscal year begins in April, a budget line dated June 2026 belongs to FY 2026–2027
- Cost Lines — Actual expenditures with date, description, and category
Budget and cost totals automatically roll up to the Initiative card's costBudget and costActual attributes. When PPM cost lines exist, these card fields are marked as auto-computed and become read-only in the card detail view.
Risk Management Tab
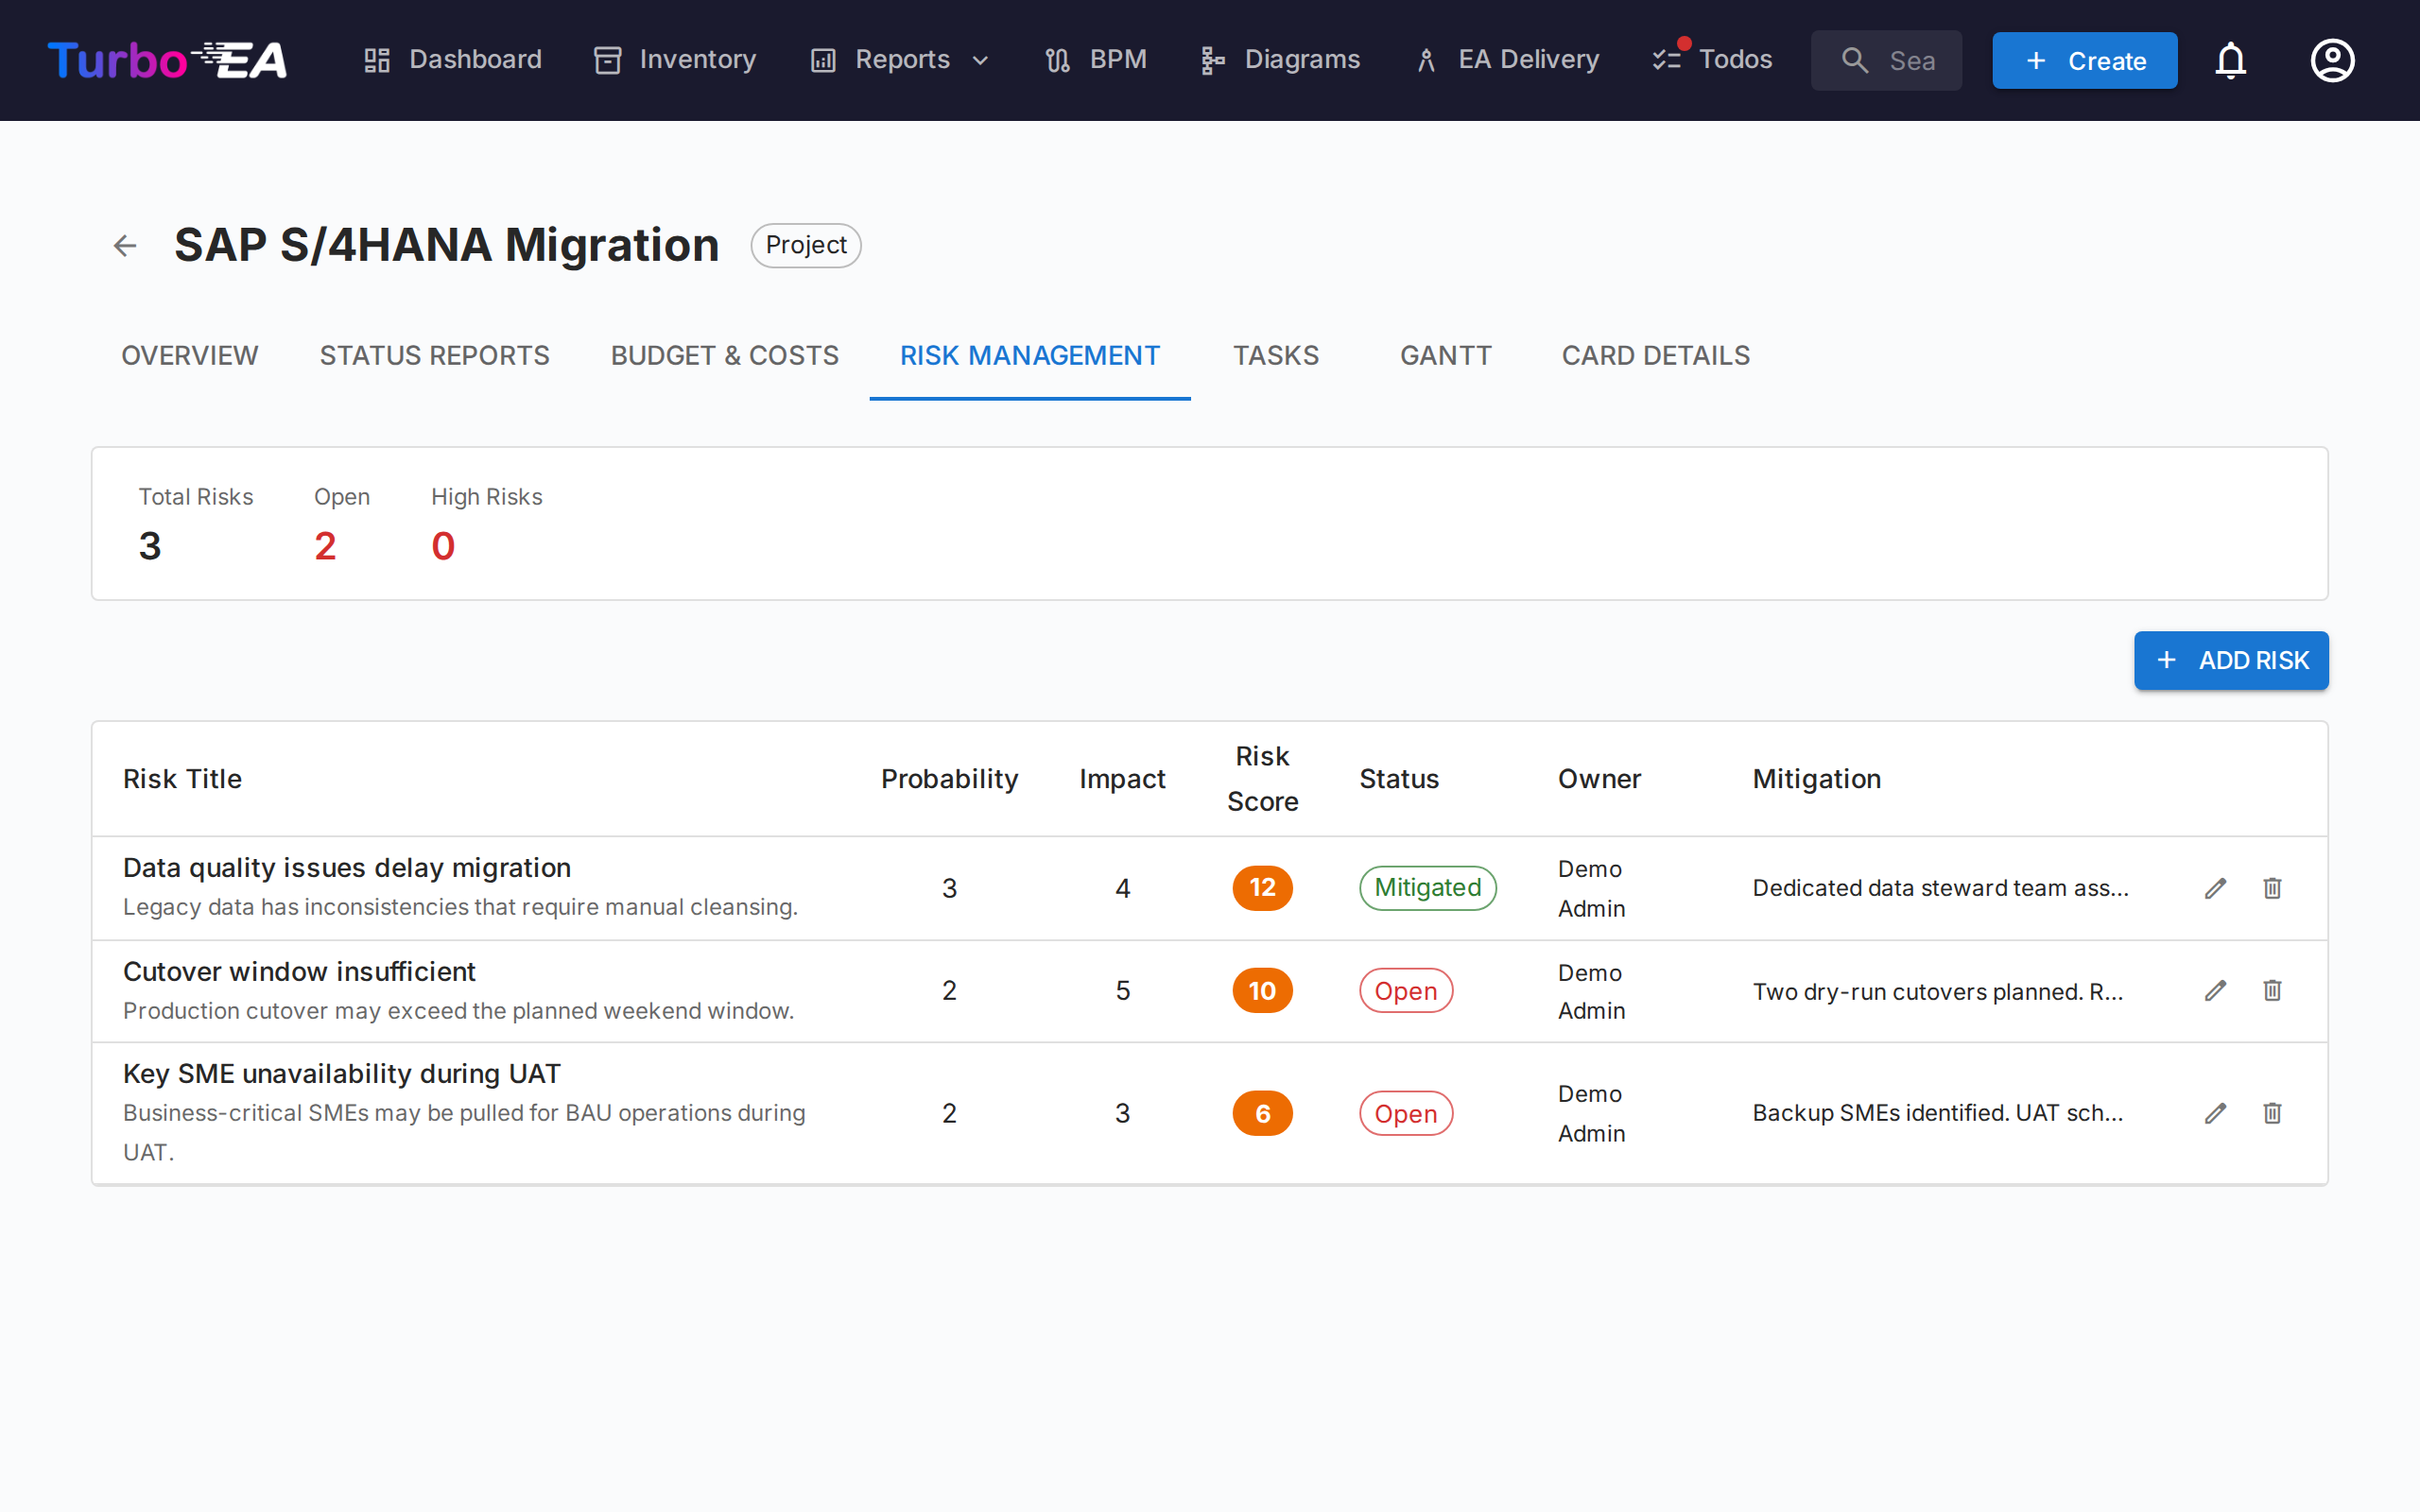
The risk register tracks project risks with:
| Field | Description |
|---|---|
| Title | Brief description of the risk |
| Probability | Likelihood score (1–5) |
| Impact | Impact score (1–5) |
| Risk Score | Auto-calculated as probability x impact |
| Status | Open, Mitigating, Mitigated, Closed, or Accepted |
| Mitigation | Planned mitigation actions |
| Owner | User responsible for managing the risk |
Tasks Tab
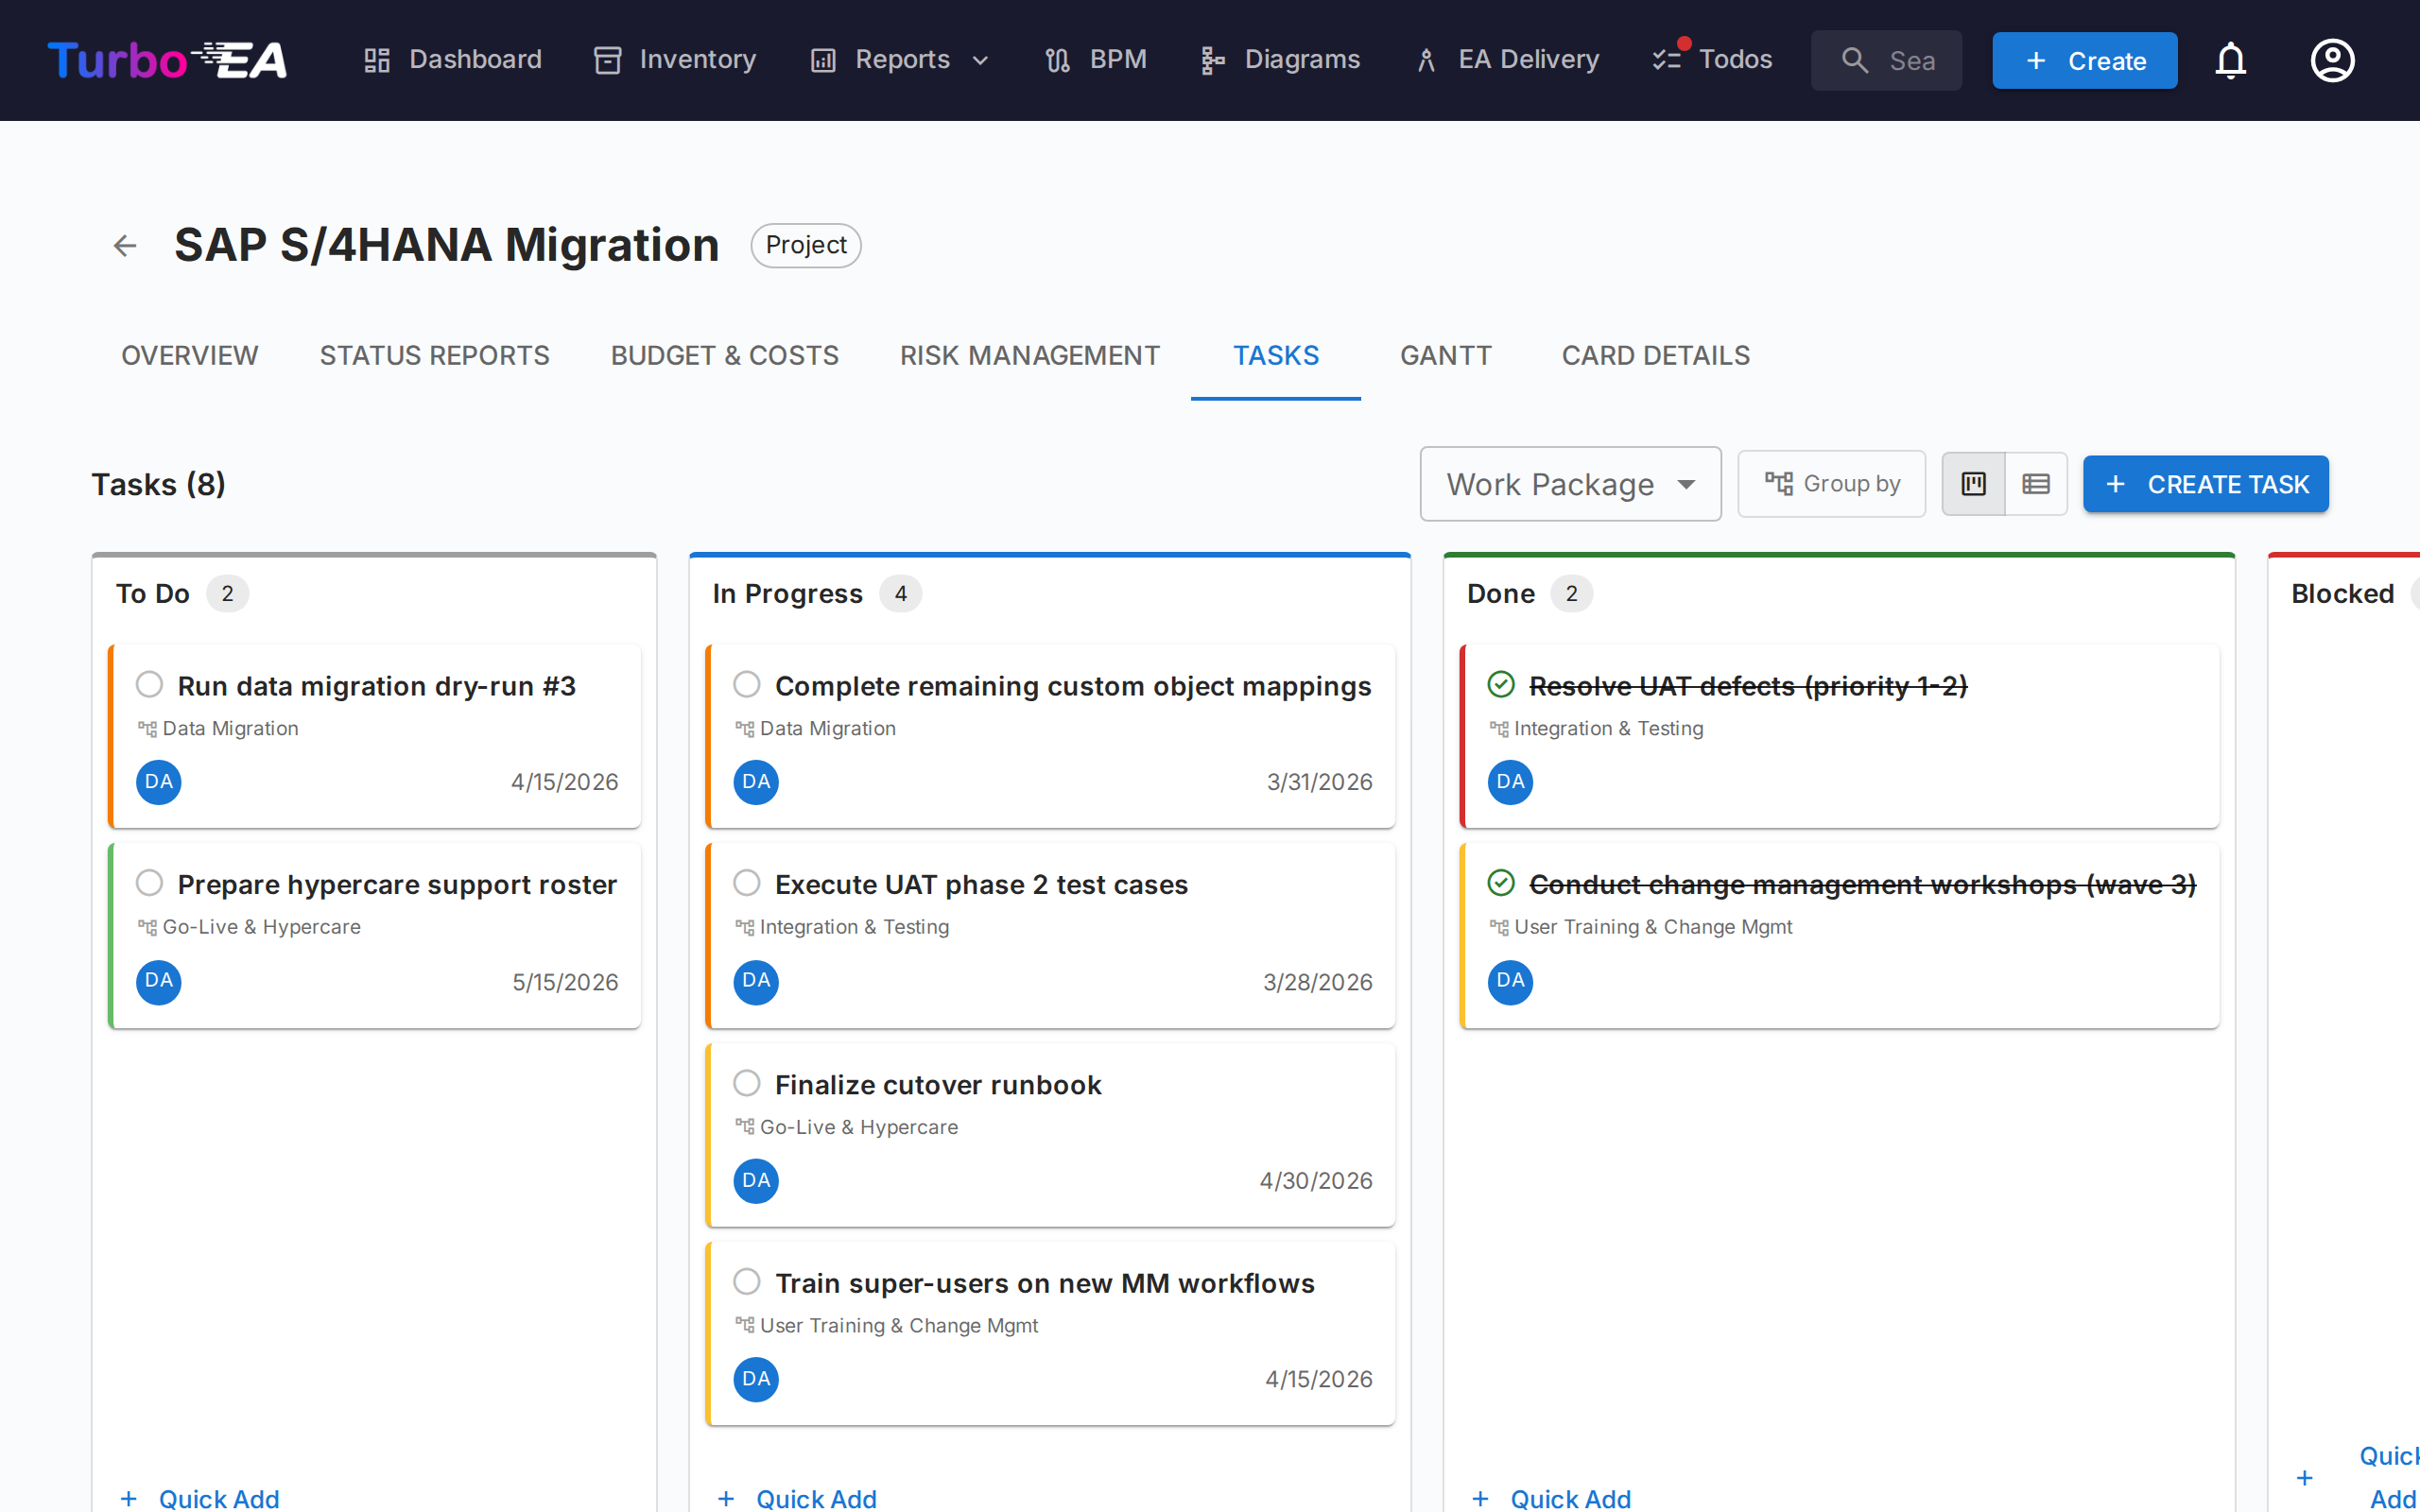
The task manager supports both Kanban board and list views with four status columns:
- To Do — Tasks not yet started
- In Progress — Tasks currently being worked on
- Done — Completed tasks
- Blocked — Tasks that cannot proceed
Tasks can be filtered and grouped by Work Breakdown Structure (WBS) item. Drag and drop cards between columns to update status. Each task supports:
- Priority levels (Critical, High, Medium, Low)
- Assignee (with notification on assignment)
- Start and due dates
- Tags for categorization
- Comments for discussion
Display filters (view mode, WBS filter, group-by toggle) persist in the URL across page refreshes.
Gantt Tab
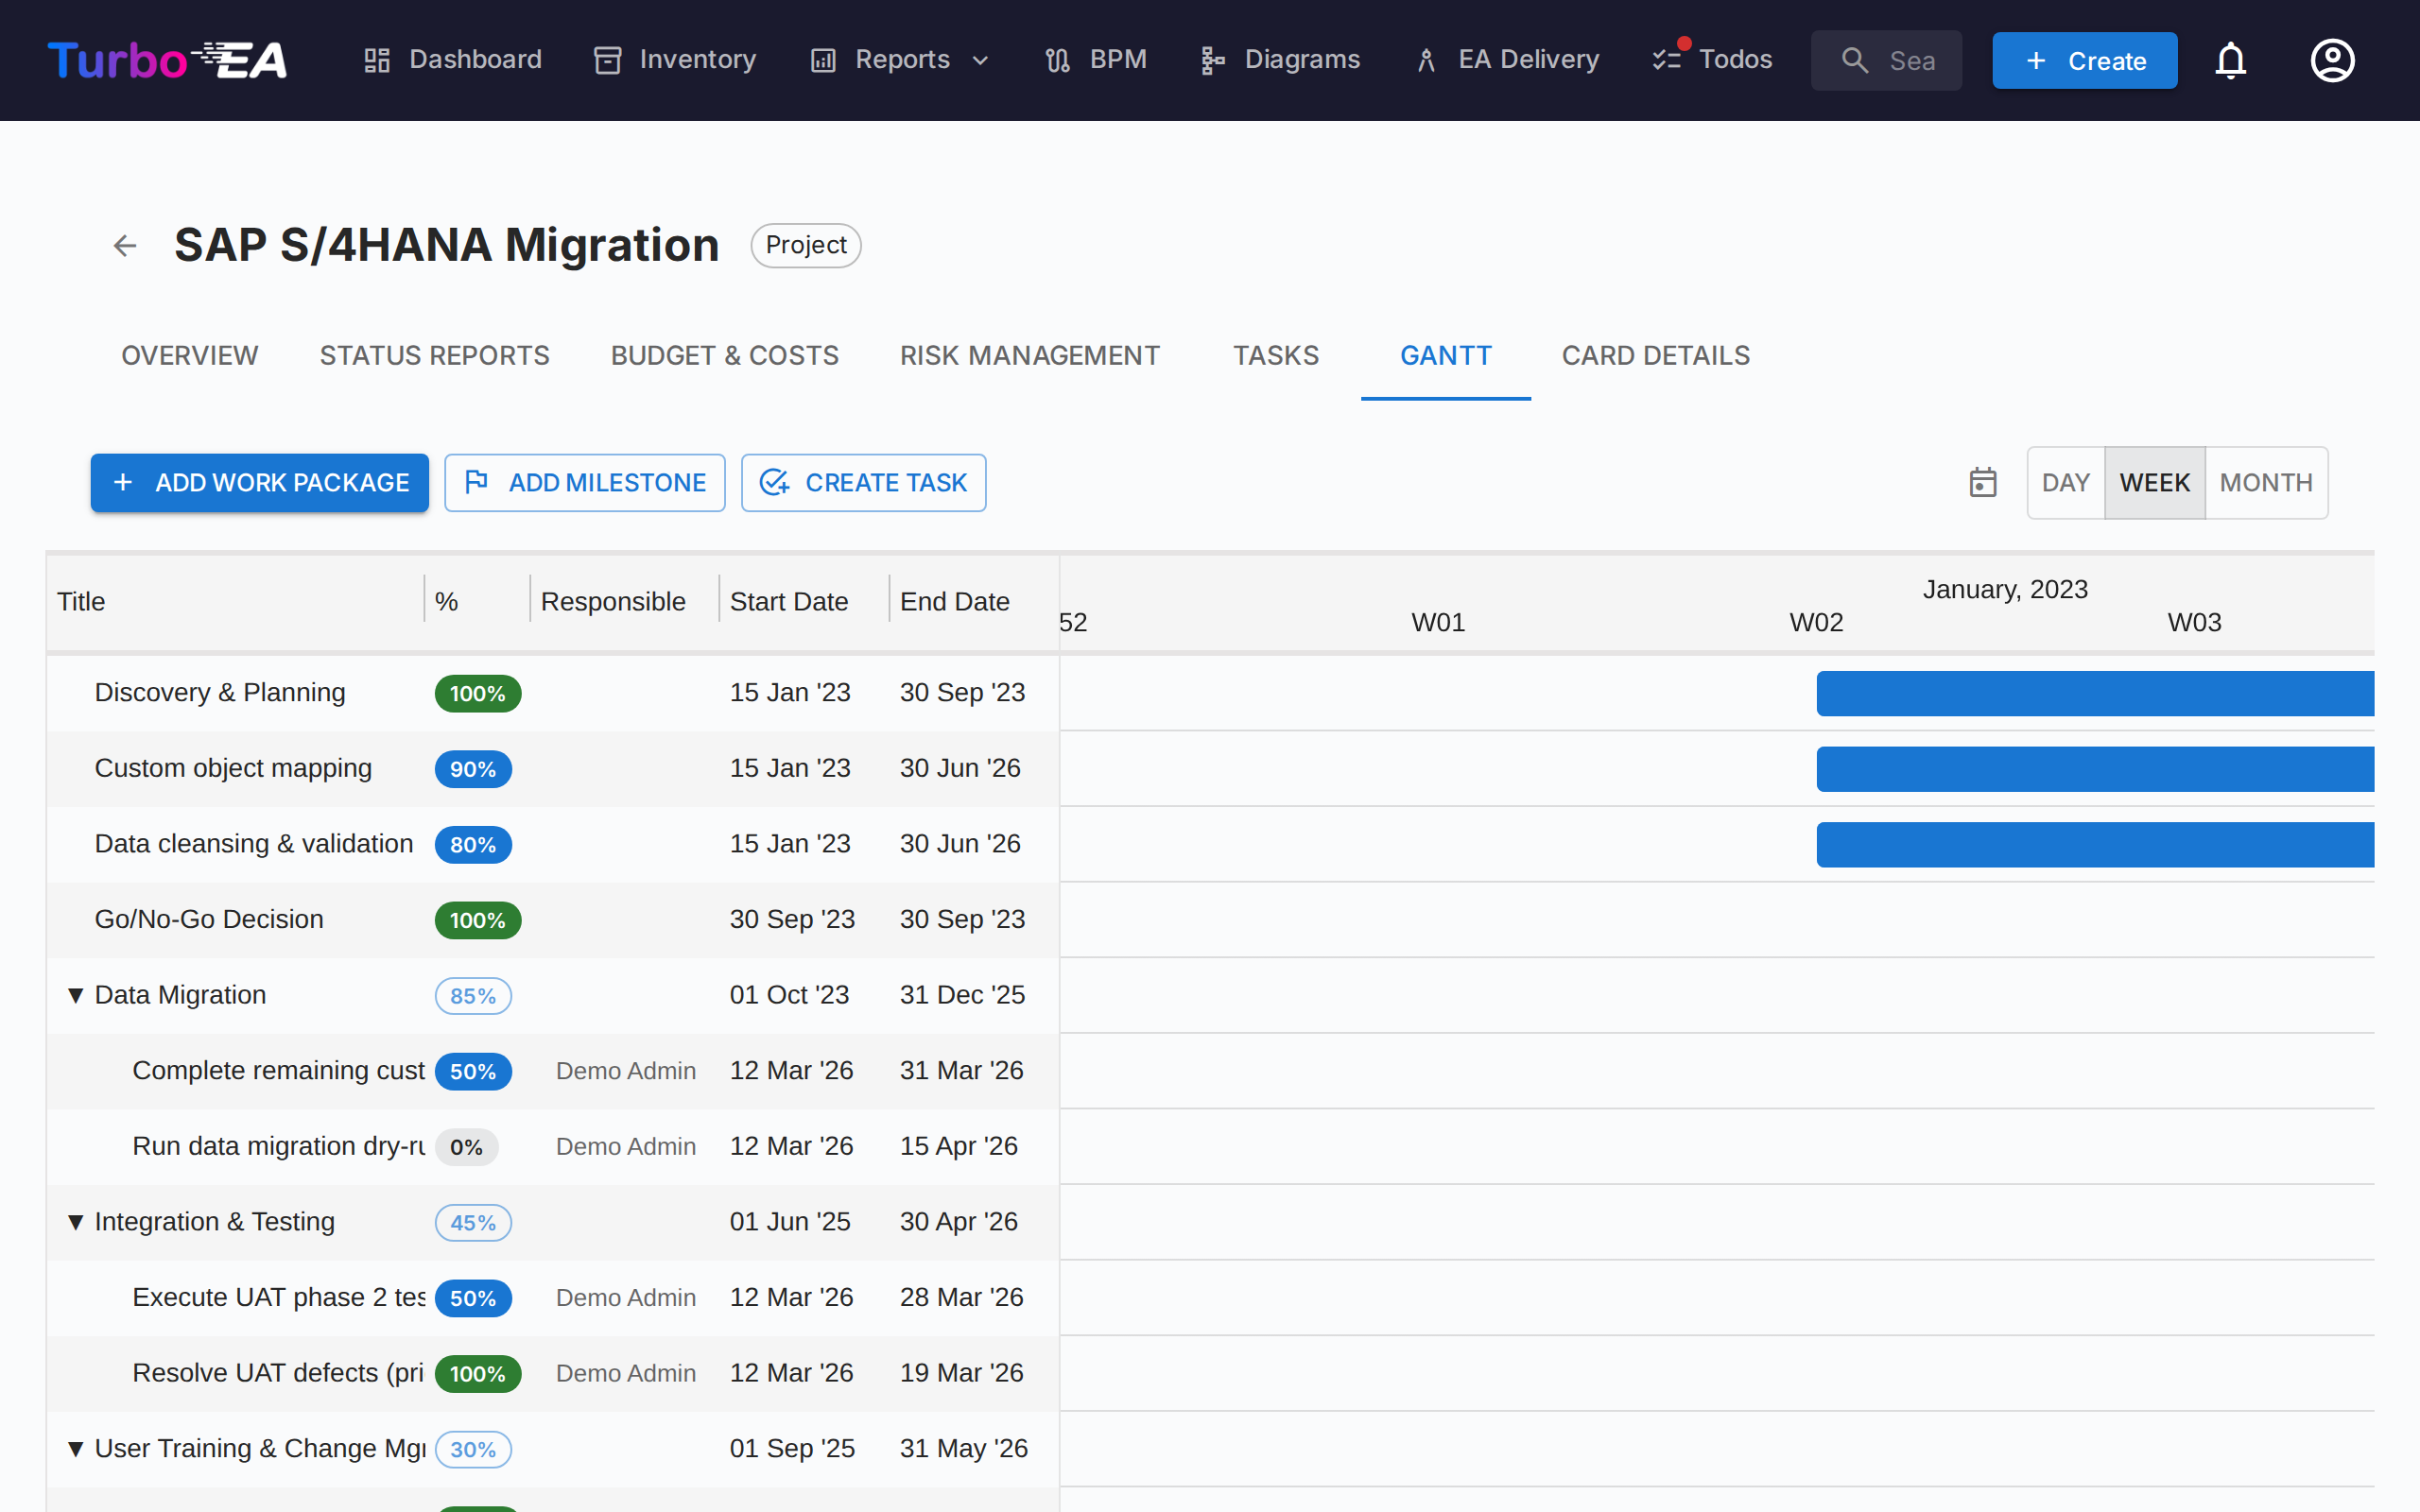
The Gantt chart visualizes the project timeline with:
- Work Packages (WBS) — Hierarchical work breakdown structure items with start/end dates
- Tasks — Individual task bars linked to work packages
- Milestones — Key dates marked with diamond indicators
- Progress Bars — Visual completion percentage. Click the percentage chip on a task or leaf work package to open a slider that snaps to 0%, 50% or 100% — matching the three task states (To Do, In Progress, Done). Parent work packages with children show a read-only chip whose value is rolled up automatically from the subtree.
- Quarterly Ticks — Timeline grid for orientation
Interact with the Gantt chart using:
- Drag bars to reschedule items
- Resize bar edges to change duration (1-day granularity)
- Right-click for context menu (edit, add task, mark done, delete)
- Today button to scroll to the current date
- View scale picker — choose between Day, Week, Month, Quarter, and Year scales; the choice is remembered in your browser
- Zoom in / Zoom out buttons — step through the same five scales one notch at a time
- Drag the dot on the right edge of one bar onto the dot on the left edge of another to create a finish-to-start dependency arrow. Dependencies work between any combination of work packages and tasks. Cycles are rejected automatically. Double-click an arrow to remove it.
Card Details Tab
The last tab shows the full card detail view, including all standard sections (description, lifecycle, attributes, relations, stakeholders, comments, history).
Work Breakdown Structure (WBS)
The WBS provides a hierarchical decomposition of project scope:
- Work Packages — Logical groupings of tasks with start/end dates and completion tracking
- Milestones — Significant events or completion points
- Hierarchy — Parent-child relationships between WBS items
- Auto-completion — Completion percentage is automatically calculated from child task done/total ratios, then rolled up recursively through the WBS hierarchy to parent items. Top-level completion represents overall initiative progress
Card Detail Integration
When PPM is enabled, Initiative cards display a PPM tab as the last tab in the card detail view. Clicking this tab navigates directly to the PPM Initiative Detail View (Overview tab). This provides a quick entry point from any Initiative card to its full PPM project page.
Conversely, the Card Details tab within the PPM Initiative Detail View shows the standard card detail sections without the PPM tab, avoiding circular navigation.
Permissions
| Permission | Description |
|---|---|
ppm.view |
View the PPM dashboard, Gantt chart, and initiative reports. Granted to all roles by default |
ppm.manage |
Create and manage status reports, tasks, costs, risks, and WBS items. Granted to Admin, BPM Admin, and Member roles |
reports.ppm_dashboard |
View the PPM portfolio dashboard. Granted to all roles by default |